
Introducing the Real Market Index: A Smarter Way to Measure Housing Affordability
By Joe Ballarino
In today’s housing market, the word “affordable” gets thrown around a lot—but often without context. Prices are high, interest rates fluctuate, and buyers and sellers alike are left wondering: What can people actually afford right now?
To answer that, we’ve developed a new benchmark: the Real Market Index (RMI). Built on decades of real data, this index shows exactly how much of a household’s income is required to afford the average monthly mortgage payment. And based on what it tells us today, sellers should take notice—buyer pressure is building.
Key Takeaways
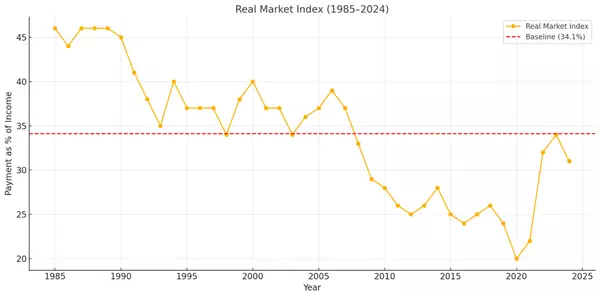
- The Real Market Index (RMI) tracks housing affordability by comparing monthly mortgage payments to annual household income.
- The historical average (baseline) is 34.1%.
- In the first half of 2025, the index climbed past the baseline to 34.9%, signaling declining affordability.
- This suggests buyers are maxed out, and sellers need to price and market with precision.
What Is the Real Market Index?
The Real Market Index tracks the percentage of a household’s gross annual income needed to cover the monthly mortgage payment on a median-priced home. It’s updated monthly and reflects the conditions faced by actual buyers, not just theoretical price charts.
How It’s Calculated
The formula is simple:
RMI = (Monthly Mortgage Payment × 12) ÷ Annual Median Household Income × 100
We use:
- Monthly mortgage payments from Bankrate’s historical mortgage payment data, based on typical 30-year fixed-rate loans with 20% down.
- Annual median household income from the U.S. Census Bureau CPS ASEC, in nominal dollars. For 2024 and 2025, we used a forecast based on a 10-year CAGR.
Historical Data: 1985 Through 2024
The Real Market Index is grounded in historical comparison. From 1985 to 2024, the average RMI was 34.1%. That means that, on average, U.S. households spent just over a third of their gross income on a new mortgage.

We use that 34.1% average as a baseline. It’s the line between a “normal” market and an overheated one:
- Above 34.1% – buyers start to pull back. The cost burden is too high, and affordability begins to break.
- Below 34.1% – affordability improves, and buyers are more likely to act.
What the History Tells Us
From 1985 through 2007, the index often ran above 34%—in part because interest rates were higher, and lending standards looser.
After the 2008 financial crisis, the pattern changed. From 2008 to 2022, the RMI remained below the historical average. Interest rates were historically low, and buyers had more breathing room.
That changed in 2023, when rising home prices and surging mortgage rates pushed the RMI right up to the 34.1% threshold. In 2024, it hovered just below it.
This shift is meaningful. We may be in a new market era where the old average (34.1%) now acts as a ceiling—a psychological and financial limit buyers are no longer willing to exceed.
2025 So Far: Buyer Pressure Is Back
In the first half of 2025, mortgage rates have stayed stubbornly high, and home prices haven’t corrected meaningfully. As a result, the Real Market Index has climbed steadily each month.

By June 2025, the RMI reached 34.9%, exceeding the baseline for the first time since 2007. That means buyers are now spending more of their income on housing than they have in over 15 years—and many simply can’t afford to.
What This Means for Sellers
The data paints a clear picture: buyers are financially stretched. While demand hasn't disappeared, it’s become much more selective. Only well-qualified, high-income buyers can compete at current prices and rates.
For sellers, this means:
- Overpricing will lead to extended days on market.
- Price reductions will become more common in many areas.
- Creative solutions—like rate buydowns, closing cost help, and flexible terms—will become more important.
If you’re thinking about selling, the window of peak demand may be closing. The affordability pressure is real, and the market is adjusting accordingly.
Looking Ahead
We’ll be publishing the Real Market Index monthly, helping buyers, sellers, and real estate professionals stay ahead of market trends with real-world affordability insight.
—Joe Ballarino
Recent Posts